Microsoft Graph API and PowerBI
A little bit about this post
At MMS 2022 I took a huge leap and briefly presented this in the Tips & Tricks Session. This was the first time I had ever presented in front of an audience.
I thought it would be good to give a bit of context on how this was conceptualised and why certain aspects are the way they are (some of them still make me shudder).
On a day to day basis, I work for a company that provides both Professional and Managed Services. As part of our service offering, we provide reporting for technical and C-Suite stakeholders. While functional, our original report ran from the Intune Data Warehouse, and it wasn’t extensible and didn’t offer much room for adding in additional metrics and visuals.
As a man who likes working with the Graph API, I thought, why can we not use the data directly from there??? Here began many hours of visiting dead ends and rabbit holes. Before we get going, lets talk about some of the challenges faced.
The first challenge was authentication. We wanted to make this work without the need for Service Accounts and Passwords etc., so we decided to use App Registrations. Unfortunately, OData feeds in Power BI did not like using dynamically generated content within the headers for authentication when creating our dashboards. This may have changed now, but if it ain’t broke don’t fix it right?
The next challenge after overcoming authentication was pagination. Now, it’s tough to do without some very complex Power BI wizardry with loops etc. So this led me to look at using Logic Apps to paginate the data for me and send it back in a response JSON.
One of the final challenges was publishing the report to the Power BI service. When published, the data refresh schedule was not available. The first issue I faced was Power BI telling me that I had an issue with Query1… This query didn’t even exist. After hours of stripping the report right back, we found it to be the way we were passing in the authentication bearer token. We resolved this by nesting (Yes!!! Nesting, I told you things made me shudder.) the Authentication function within each query. After we fixed this and re-published the report, we were hopeful, but that hope lasted no more than a minute. Power BI then suggested the data was not directly, again back into the Transform Data screen to see what we could do… The final solution to this??? (Shudders at the ready!!) Nest our other two functions into the queries too.
Moving swiftly on, let’s look at some of this in action. During this post, we will create a basic report with Power BI. We will pull in two tables, Devices and Device Hardware information.
What do we need for the basics?
If you would like to follow along with the post you will need the following;
- The ability to create an Azure AD App Registration and Grant Admin Consent
- The ability to create an Azure Logic App
- PowerBI Desktop
Let’s get started
During this post, we will be looking at the web call to gather the bearer token and two different methods of getting data from the Graph API, and how we use them side by side to ensure we are not burning money on a consumption Logic Apps.
Authentication
Lets start by creating an App Registration with the following Application permissions.
- DeviceManagementManagedDevices.Read.All
If you are not familiar with creating App Registrations, take a look at my Create an Azure App Registration post.
Once you have added permissions and granted consent, you need to obtain a secret, this can be done from the App Registration by;
- Clicking Certificates & Secrets
- Click New client secret
- Enter a description and select the validity period of the secret, then click Add
- Click the Copy icon next to the Value contents
The last step is important, as once you navigate away from this page it disappears and cannot be retrieved. You can always create another, so all is not lost.
You now have the start of the authentication piece, lets head over to Power BI and enter the Power Query Editor (Transform Data) and create three Parameters.
- ApplicationID: This will be the Application (client) ID of the App Registration
- ApplicationSecret: This will be the secret value copied previously
- TenantID: Your Azure Tenant ID
We will halt the authentication section here for now as we need some other components to start retrieving data.
The Logic App
You can simply deploy the logic app using the button below, or follow the manual steps detailed below.
- Logic App Blade
- Click Add
- Select your Subscription and Resource Group
- Give you Logic App a meaningful name (e.g. EUC-MSGRAPHCALL-v1)
- For Publish Select Workflow and select your desired Region
- Select your desired plan, for this post I will be using Consumption
- (Optional) Select Zone Redundancy
- (Optional) Add Tags
- Click Review + Create, then click Create
- Once the deployment is complete click Go to resource
- Select a trigger, template or click Blank Logic App
- From the ribbon, click the Code view button
- Copy and paste the JSON from the Logic App Code drop down below
- Click Save
Feel free to dig into the Logic App and look at how the data is being processed, but for now the logic ready for use!!!
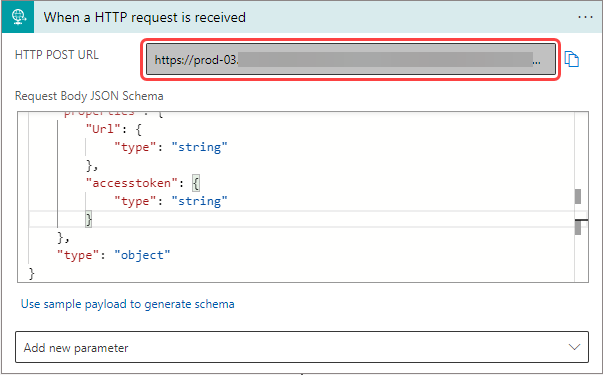
One of the final things to do before we start building up a queries is to add a parameter in Power BI called LogicAppURL. The value of this parameter can be found on the HTTP trigger from within the logic app as shown below.
Creating the first query
Lets head back in to the Power Query Editor (Transform Data) and start building up our first query.
- From the ribbon select New Source > Blank Query
- Right-click on your new query, select Rename and enter Devices
- Right-click on the Devices query, select Advanced Editor
- Paste the following content into the editor, then click Done
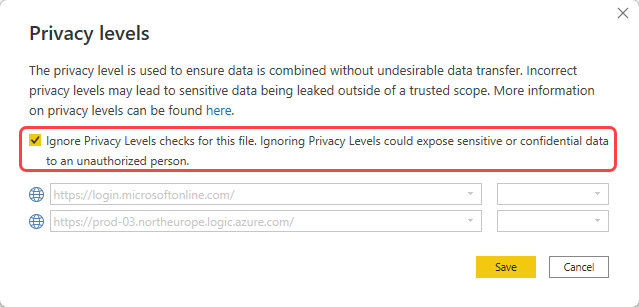
- A yellow banner will appear stating Information is required about data privacy, click Continue
- Select Ignore Privacy (as per below screenshot), Alternatively, change the data sources to private, then click Save
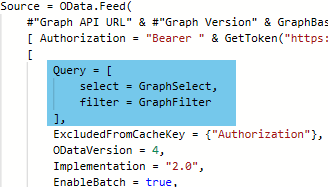
Let’s break the query down to gain further understanding of it. First lets look at the SessionToken nested function, this is where the bearer token is obtained by using the provided ApplicationID and ApplicationSecret values. The function builds up a web call with additional headers and requests the response as a JSON, from this point we then extract the returned access_token.
The second of three nested functions is the MSGraphLA, this is the function used to send information to the Logic App that you created. The way it handles the data is pretty simple, again this function uses a web call to post a JSON object to the Logic App. The JSON is made up of the SessionToken which slots into the accesstoken JSON value, and the GraphURL which is the value that is put into the function.
The final nested function is GraphCall, this function is to be used on an ad-hoc basis. For example, I use this function when I collect the Hardware Information for a device, and the reason I do that is because when you query the device endpoint like we have done here, you do not get all of the values from the Hardware Information field. This function is basically the direct call to the Graph API, without pagination.
Ok, so that’s a start, you are now at a point were you have data within you Power BI Report, Now you can feel free to continue the drill down of data yourself, however for anyone who wants that old Art Attack moment of ‘Here’s one I made earlier’ you can use the below query.
NOTE: There is still unexpanded columns with the query below, please expand them if required.
Using the Ad-hoc GraphCall Function
In the previous part of this post, you created the first query which used the Logic App to gather all of its data. This section will explain how to use this side by side with an ad-hoc function to gather additional data from the Graph API.
For this example we will focus on gathering the Hardware Information of the devices. As mentioned above, calling the API Endpoint for the devices does not provide all of the information within the Hardware Information object, so to get the most of the dataset available we need to call device endpoint with the device id to expand the hardware information. Lets jump in and get going.
- From the ribbon select New Source > Blank Query
- Right-click on your new query, select Rename and enter Device Hardware Information
- Right-click on the Device Hardware Information query, select Advanced Editor
- Paste the following content into the editor, then click Done
- Notice you now have all of your device ids, from the ribbon click Add Column
- Click Custom Column, enter CallURL as the column name
- Enter `each “deviceManagement/managedDevices/” & [id] & “?$select=hardwareInformation”`, then click OK
- Create another Custom Column, enter Graph Web Call as the name
- Enter `each #”GraphCall”([CallURL])`, then click OK
- You will be prompted to Enter Credentials, click on the button, ensure Anonymous is selected, then click Connect (This may fail the first time, if it does cancel the prompt and then click Edit Credentials again)
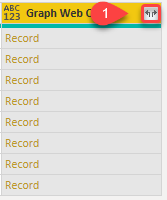
- You will now see an additional column per device, click on the icon next to Graph Web Call in the column header
- Un-tick all options but hardwareInformation (I would also un-tick Use original column name as prefix), then click OK
- (Optional) Right-click the CallURL column, then select Remove
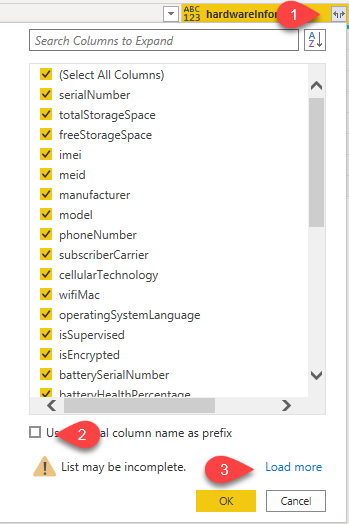
- Click on the icon next to hardwareInformation in the column header, un-tick Use original column name as prefix, then click Load More, then click OK
Voilà!, you now have the hardware information for each device. There are still further columns you can expand should you see fit, but the data is now usable to create some lovely visuals.
You can compare the hardwareInformation from this table to the one in the devices table and you will see the comparable difference in the datasets.
Linking the datasets
The final piece of the puzzle is to link the tables together do you can create free flowing reports and visuals. You may find that this has been done Automagically for you, however it is better to cover it just in the edge case that it doesn’t.
If you haven’t already done so, hit the save button and save your progress. Once saved minimise or close the Transform data window as it is not required.
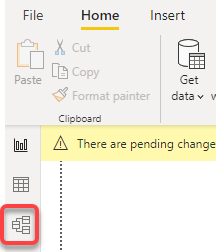
- From the main Power BI Screen click the Model button in the left-hand pane
- Find id in the Devices table, drag this to the id field within the Device Hardware Information table
Conclusion
You now have the tools to gather all of your data into Power BI, one thing to note is that depending on amount of objects you are querying your refresh time may be extended. Using the method where you collect devices ids and then call on each object to gather data also extends the refresh time. However, if you are running this on a refresh cycle that may not be such an issue, but it is worth noting.
There may be better ways to do this, but this is only the first iteration of a working model, there may very well be more to come in the future.
If you manage multiple environments, you will only need the one Logic App. The ApplicationID, ApplicationSecret and TenantID are the only changes that would need to be made.
If you like the post, be sure to leave feedback below.
Categories
Tags

Microsoft Graph API and PowerBI
A little bit about this post
At MMS 2022 I took a huge leap and briefly presented this in the Tips & Tricks Session. This was the first time I had ever presented in front of an audience.
I thought it would be good to give a bit of context on how this was conceptualised and why certain aspects are the way they are (some of them still make me shudder).
On a day to day basis, I work for a company that provides both Professional and Managed Services. As part of our service offering, we provide reporting for technical and C-Suite stakeholders. While functional, our original report ran from the Intune Data Warehouse, and it wasn’t extensible and didn’t offer much room for adding in additional metrics and visuals.
As a man who likes working with the Graph API, I thought, why can we not use the data directly from there??? Here began many hours of visiting dead ends and rabbit holes. Before we get going, lets talk about some of the challenges faced.
The first challenge was authentication. We wanted to make this work without the need for Service Accounts and Passwords etc., so we decided to use App Registrations. Unfortunately, OData feeds in Power BI did not like using dynamically generated content within the headers for authentication when creating our dashboards. This may have changed now, but if it ain’t broke don’t fix it right?
The next challenge after overcoming authentication was pagination. Now, it’s tough to do without some very complex Power BI wizardry with loops etc. So this led me to look at using Logic Apps to paginate the data for me and send it back in a response JSON.
One of the final challenges was publishing the report to the Power BI service. When published, the data refresh schedule was not available. The first issue I faced was Power BI telling me that I had an issue with Query1… This query didn’t even exist. After hours of stripping the report right back, we found it to be the way we were passing in the authentication bearer token. We resolved this by nesting (Yes!!! Nesting, I told you things made me shudder.) the Authentication function within each query. After we fixed this and re-published the report, we were hopeful, but that hope lasted no more than a minute. Power BI then suggested the data was not directly, again back into the Transform Data screen to see what we could do… The final solution to this??? (Shudders at the ready!!) Nest our other two functions into the queries too.
Moving swiftly on, let’s look at some of this in action. During this post, we will create a basic report with Power BI. We will pull in two tables, Devices and Device Hardware information.
What do we need for the basics?
If you would like to follow along with the post you will need the following;
- The ability to create an Azure AD App Registration and Grant Admin Consent
- The ability to create an Azure Logic App
- PowerBI Desktop
Let’s get started
During this post, we will be looking at the web call to gather the bearer token and two different methods of getting data from the Graph API, and how we use them side by side to ensure we are not burning money on a consumption Logic Apps.
Authentication
Lets start by creating an App Registration with the following Application permissions.
- DeviceManagementManagedDevices.Read.All
If you are not familiar with creating App Registrations, take a look at my Create an Azure App Registration post.
Once you have added permissions and granted consent, you need to obtain a secret, this can be done from the App Registration by;
- Clicking Certificates & Secrets
- Click New client secret
- Enter a description and select the validity period of the secret, then click Add
- Click the Copy icon next to the Value contents
The last step is important, as once you navigate away from this page it disappears and cannot be retrieved. You can always create another, so all is not lost.
You now have the start of the authentication piece, lets head over to Power BI and enter the Power Query Editor (Transform Data) and create three Parameters.
- ApplicationID: This will be the Application (client) ID of the App Registration
- ApplicationSecret: This will be the secret value copied previously
- TenantID: Your Azure Tenant ID
We will halt the authentication section here for now as we need some other components to start retrieving data.
The Logic App
You can simply deploy the logic app using the button below, or follow the manual steps detailed below.
- Logic App Blade
- Click Add
- Select your Subscription and Resource Group
- Give you Logic App a meaningful name (e.g. EUC-MSGRAPHCALL-v1)
- For Publish Select Workflow and select your desired Region
- Select your desired plan, for this post I will be using Consumption
- (Optional) Select Zone Redundancy
- (Optional) Add Tags
- Click Review + Create, then click Create
- Once the deployment is complete click Go to resource
- Select a trigger, template or click Blank Logic App
- From the ribbon, click the Code view button
- Copy and paste the JSON from the Logic App Code drop down below
- Click Save
Feel free to dig into the Logic App and look at how the data is being processed, but for now the logic ready for use!!!
One of the final things to do before we start building up a queries is to add a parameter in Power BI called LogicAppURL. The value of this parameter can be found on the HTTP trigger from within the logic app as shown below.
Creating the first query
Lets head back in to the Power Query Editor (Transform Data) and start building up our first query.
- From the ribbon select New Source > Blank Query
- Right-click on your new query, select Rename and enter Devices
- Right-click on the Devices query, select Advanced Editor
- Paste the following content into the editor, then click Done
- A yellow banner will appear stating Information is required about data privacy, click Continue
- Select Ignore Privacy (as per below screenshot), Alternatively, change the data sources to private, then click Save
Let’s break the query down to gain further understanding of it. First lets look at the SessionToken nested function, this is where the bearer token is obtained by using the provided ApplicationID and ApplicationSecret values. The function builds up a web call with additional headers and requests the response as a JSON, from this point we then extract the returned access_token.
The second of three nested functions is the MSGraphLA, this is the function used to send information to the Logic App that you created. The way it handles the data is pretty simple, again this function uses a web call to post a JSON object to the Logic App. The JSON is made up of the SessionToken which slots into the accesstoken JSON value, and the GraphURL which is the value that is put into the function.
The final nested function is GraphCall, this function is to be used on an ad-hoc basis. For example, I use this function when I collect the Hardware Information for a device, and the reason I do that is because when you query the device endpoint like we have done here, you do not get all of the values from the Hardware Information field. This function is basically the direct call to the Graph API, without pagination.
Ok, so that’s a start, you are now at a point were you have data within you Power BI Report, Now you can feel free to continue the drill down of data yourself, however for anyone who wants that old Art Attack moment of ‘Here’s one I made earlier’ you can use the below query.
NOTE: There is still unexpanded columns with the query below, please expand them if required.
Using the Ad-hoc GraphCall Function
In the previous part of this post, you created the first query which used the Logic App to gather all of its data. This section will explain how to use this side by side with an ad-hoc function to gather additional data from the Graph API.
For this example we will focus on gathering the Hardware Information of the devices. As mentioned above, calling the API Endpoint for the devices does not provide all of the information within the Hardware Information object, so to get the most of the dataset available we need to call device endpoint with the device id to expand the hardware information. Lets jump in and get going.
- From the ribbon select New Source > Blank Query
- Right-click on your new query, select Rename and enter Device Hardware Information
- Right-click on the Device Hardware Information query, select Advanced Editor
- Paste the following content into the editor, then click Done
- Notice you now have all of your device ids, from the ribbon click Add Column
- Click Custom Column, enter CallURL as the column name
- Enter `each “deviceManagement/managedDevices/” & [id] & “?$select=hardwareInformation”`, then click OK
- Create another Custom Column, enter Graph Web Call as the name
- Enter `each #”GraphCall”([CallURL])`, then click OK
- You will be prompted to Enter Credentials, click on the button, ensure Anonymous is selected, then click Connect (This may fail the first time, if it does cancel the prompt and then click Edit Credentials again)
- You will now see an additional column per device, click on the icon next to Graph Web Call in the column header
- Un-tick all options but hardwareInformation (I would also un-tick Use original column name as prefix), then click OK
- (Optional) Right-click the CallURL column, then select Remove
- Click on the icon next to hardwareInformation in the column header, un-tick Use original column name as prefix, then click Load More, then click OK
Voilà!, you now have the hardware information for each device. There are still further columns you can expand should you see fit, but the data is now usable to create some lovely visuals.
You can compare the hardwareInformation from this table to the one in the devices table and you will see the comparable difference in the datasets.
Linking the datasets
The final piece of the puzzle is to link the tables together do you can create free flowing reports and visuals. You may find that this has been done Automagically for you, however it is better to cover it just in the edge case that it doesn’t.
If you haven’t already done so, hit the save button and save your progress. Once saved minimise or close the Transform data window as it is not required.
- From the main Power BI Screen click the Model button in the left-hand pane
- Find id in the Devices table, drag this to the id field within the Device Hardware Information table
Conclusion
You now have the tools to gather all of your data into Power BI, one thing to note is that depending on amount of objects you are querying your refresh time may be extended. Using the method where you collect devices ids and then call on each object to gather data also extends the refresh time. However, if you are running this on a refresh cycle that may not be such an issue, but it is worth noting.
There may be better ways to do this, but this is only the first iteration of a working model, there may very well be more to come in the future.
If you manage multiple environments, you will only need the one Logic App. The ApplicationID, ApplicationSecret and TenantID are the only changes that would need to be made.
If you like the post, be sure to leave feedback below.