
Graph API & Power BI – MMS Edition
Mid-January 2024, the OData feed metadata for the managedDevice endpoint broke, which effected the Intune Data Import query.
The GitHub Repository has been updated to reflect this.
If you are wanting to update a current report, use the below link to obtain an updated Intune Data Import query.
I would also recommend updating your Template Query.
What a blast this year at MMS MOA 2023!!. The time last year I spoke for the first time and did a quick 3 minute session in Tips & Tricks and this year (2023) I returned as a speaker, with an improved and fleshed out Power BI Session alongside Steve Beaumont. Some may recall my previous post Microsoft Graph API and PowerBI, there will be some reference back to this as we go through this one.
We covered a lot on stage, and this post is here to help flesh out those configuration area’s that we didn’t cover in the session, and also has the link to the goodies for you to start the journey to feature rich reports with Intune & Power BI.
Getting Prepared
As per the previous post, we will still be using a service principal to access the data, however we will also be expanding this scope to allowing data read access to your log analytics workspace.
The dataset that is available for download has the following **Application** API permission requirements for Intune and AAD:
- DeviceManagementManagedDevices.Read.All (Intune Devices Data & Autopilot Events)
- Device.Read.All (AAD Data – Device)
- User.Read.All (AAD Data – User)
For information on creating a service principal (App Registration) and assigning the permissions, please refer to one of my previous post.
Aside from the above, we also need to grant access to the Log Analytics Workspace that holds the Windows Update for Business reports data, please refer to the following post for more information on how to grant access to the service principal.
You can utilise the same service principal for both the Intune and Log Analytics API’s, just ensure you have the correct permissions assigned.
Once all of the permissions have been granted, you will need the following information to configure the Power BI report:
- Tenant ID – This is the tenant ID of the Azure AD Tenant
- Application ID – This is the Application ID of the App Registration
- Application Secret – An application secret key of the App Registration
- Log Analytics Workspace ID – This is the Workspace ID of the Log Analytics Workspace
Configuring the Power BI Report
The Power BI Files used in the session are available for download from the below button.
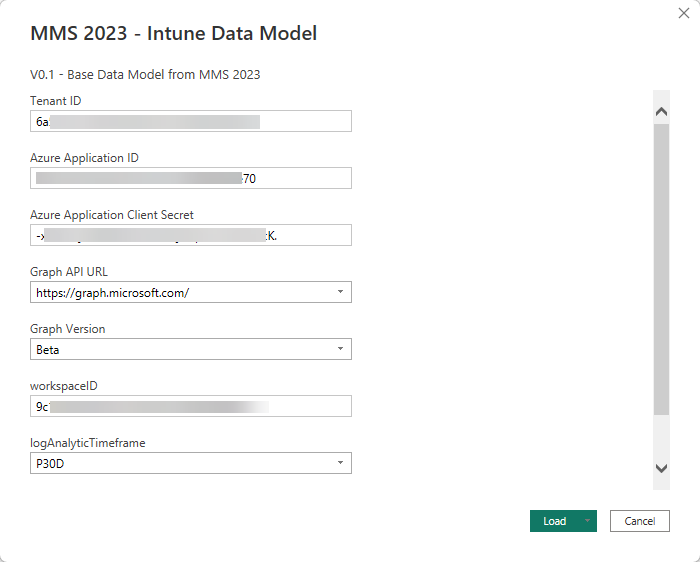
Once you have downloaded the files, you will need to open the MMS 2023 – Intune Data Model.pbit file, once launched you will be prompted to enter the information we gathered in the previous section. In addition to this, you will also need to select a time period for the data from the Log Analytics Workspace, I have put this in a drop down option, but this can be amended to suit your needs once the report is loaded.
The logicAppURL is not required for the report to function, however there is a template query which will use this for data ingestion and this was again the premise of my previous post, where the Deploy to Azure Button will allow you to deploy the Logic App in under 3 minutes.
It is important that you select the beta option from the Graph Version dropdown.
This should leave you with something like the below configuration screen.
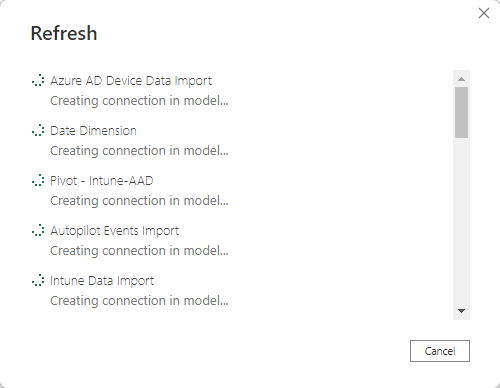
Once you click Load, you will be prompted about privacy levels, ensure you configure these as Public for the purposes of this guide, this is the only configuration that has been tested and confirmed working. This will then initiate the data load from the API’s and Log Analytics Workspace.
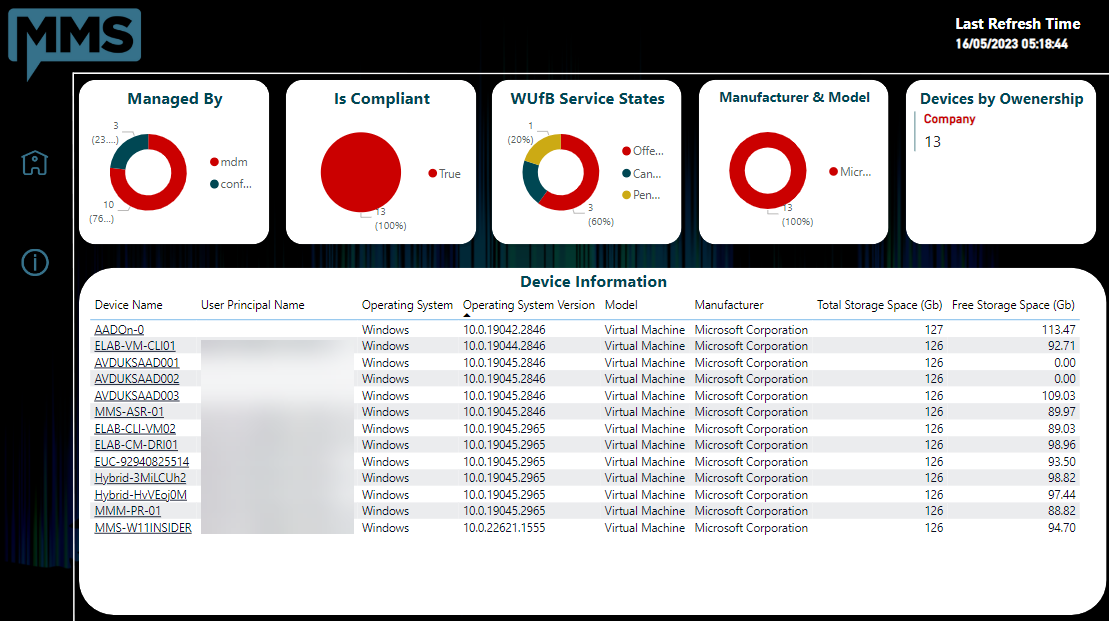
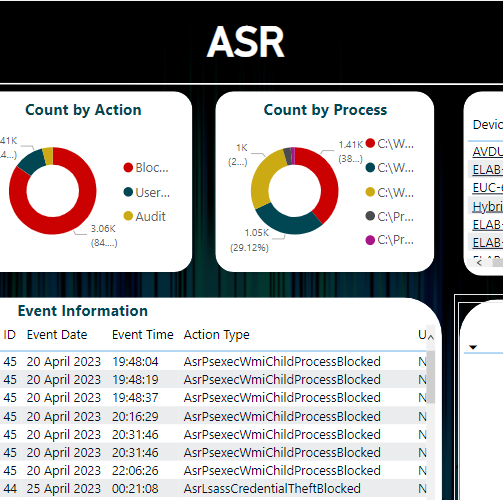
Now we have the data loaded, we can start to build out the reports, you will see that there is a template page with the report which demonstrates basic usage of the data model, this is a good starting point for you to build out your own reports.
To further enhance the usage of the report, you should look to publish the report to the Power BI Service, this will allow you to configure the report to refresh on a schedule, and also allow you to share the report with other users. Please see the Microsoft Documentation for more information on publishing Power BI Desktop files to the Power BI Service.
You will need a Power BI Pro License to publish the data model to the Power BI Service.
Expanding the Report
So now we have the report loaded, we can start to expand on the report and add additional data from other Microsoft Graph and Log Analytics endpoints. A few things do need to be taken into account when adding additional data to the report, and these are as follows:
- Permissions – The service principal will need to have the correct permissions assigned to access the data.
- Error Fields – You may see additional fields in the data table that you do not see when querying the Graph API Directly, it is best to only select the fields you need.
- Standardisation – Standardise your queries where possible.
- Resource Authentication – The GraphToken function accepts an input which is used to determine the resource to authenticate against, this is important when you are querying different API’s, i.e. Graph and Log Analytics.
Template Queries
There are a number of template queries that are available in the report, these are as follows:
- Native Web Contents – This query is used to query the Graph API directly, this will not handle pagination over 1000 objects.
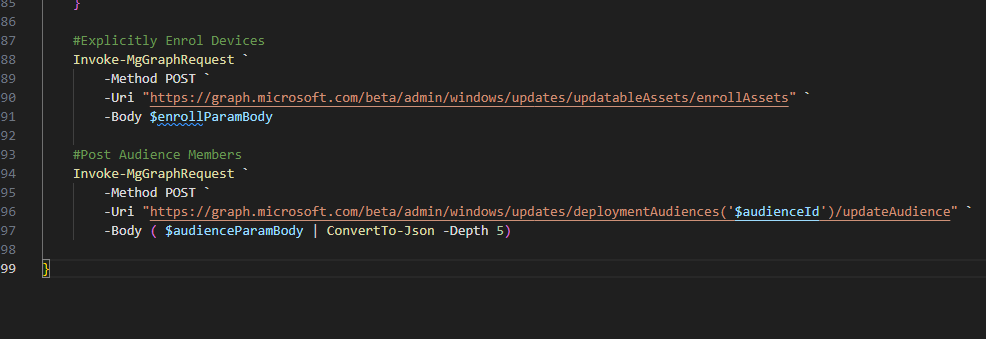
- Invoked Logic App – If you implemented the logic app to query the data, this query will be used to interact with the Logic App to gather data.
- Template Graph Call – This query will use the odata query to obtain the data from the Graph API, this will handle pagination natively.
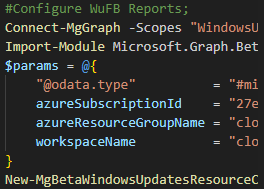
There is not a template query for the Log Analytics Workspace, however you can copy the query of the WUfB report and modify it to suit your needs.
Tips & Tricks from the Session
- Friendly Names Everywhere – Rename your columns and tables to something that makes sense enmasse, this will make it easier to build out your reports collaboratively.
- Set your Data Types – Ensure you set the data types for your columns, this will ensure that the data is displayed correctly in the report & it will also enhance the report performance.
- Only Get the data that is required – When querying the Graph API, only select the fields that you need, this will reduce the amount of data that is returned and will also improve the performance of the report.
Categories
Tags

Graph API & Power BI – MMS Edition
Mid-January 2024, the OData feed metadata for the managedDevice endpoint broke, which effected the Intune Data Import query.
The GitHub Repository has been updated to reflect this.
If you are wanting to update a current report, use the below link to obtain an updated Intune Data Import query.
I would also recommend updating your Template Query.
What a blast this year at MMS MOA 2023!!. The time last year I spoke for the first time and did a quick 3 minute session in Tips & Tricks and this year (2023) I returned as a speaker, with an improved and fleshed out Power BI Session alongside Steve Beaumont. Some may recall my previous post Microsoft Graph API and PowerBI, there will be some reference back to this as we go through this one.
We covered a lot on stage, and this post is here to help flesh out those configuration area’s that we didn’t cover in the session, and also has the link to the goodies for you to start the journey to feature rich reports with Intune & Power BI.
Getting Prepared
As per the previous post, we will still be using a service principal to access the data, however we will also be expanding this scope to allowing data read access to your log analytics workspace.
The dataset that is available for download has the following **Application** API permission requirements for Intune and AAD:
- DeviceManagementManagedDevices.Read.All (Intune Devices Data & Autopilot Events)
- Device.Read.All (AAD Data – Device)
- User.Read.All (AAD Data – User)
For information on creating a service principal (App Registration) and assigning the permissions, please refer to one of my previous post.
Aside from the above, we also need to grant access to the Log Analytics Workspace that holds the Windows Update for Business reports data, please refer to the following post for more information on how to grant access to the service principal.
You can utilise the same service principal for both the Intune and Log Analytics API’s, just ensure you have the correct permissions assigned.
Once all of the permissions have been granted, you will need the following information to configure the Power BI report:
- Tenant ID – This is the tenant ID of the Azure AD Tenant
- Application ID – This is the Application ID of the App Registration
- Application Secret – An application secret key of the App Registration
- Log Analytics Workspace ID – This is the Workspace ID of the Log Analytics Workspace
Configuring the Power BI Report
The Power BI Files used in the session are available for download from the below button.
Once you have downloaded the files, you will need to open the MMS 2023 – Intune Data Model.pbit file, once launched you will be prompted to enter the information we gathered in the previous section. In addition to this, you will also need to select a time period for the data from the Log Analytics Workspace, I have put this in a drop down option, but this can be amended to suit your needs once the report is loaded.
The logicAppURL is not required for the report to function, however there is a template query which will use this for data ingestion and this was again the premise of my previous post, where the Deploy to Azure Button will allow you to deploy the Logic App in under 3 minutes.
It is important that you select the beta option from the Graph Version dropdown.
This should leave you with something like the below configuration screen.
Once you click Load, you will be prompted about privacy levels, ensure you configure these as Public for the purposes of this guide, this is the only configuration that has been tested and confirmed working. This will then initiate the data load from the API’s and Log Analytics Workspace.
Now we have the data loaded, we can start to build out the reports, you will see that there is a template page with the report which demonstrates basic usage of the data model, this is a good starting point for you to build out your own reports.
To further enhance the usage of the report, you should look to publish the report to the Power BI Service, this will allow you to configure the report to refresh on a schedule, and also allow you to share the report with other users. Please see the Microsoft Documentation for more information on publishing Power BI Desktop files to the Power BI Service.
You will need a Power BI Pro License to publish the data model to the Power BI Service.
Expanding the Report
So now we have the report loaded, we can start to expand on the report and add additional data from other Microsoft Graph and Log Analytics endpoints. A few things do need to be taken into account when adding additional data to the report, and these are as follows:
- Permissions – The service principal will need to have the correct permissions assigned to access the data.
- Error Fields – You may see additional fields in the data table that you do not see when querying the Graph API Directly, it is best to only select the fields you need.
- Standardisation – Standardise your queries where possible.
- Resource Authentication – The GraphToken function accepts an input which is used to determine the resource to authenticate against, this is important when you are querying different API’s, i.e. Graph and Log Analytics.
Template Queries
There are a number of template queries that are available in the report, these are as follows:
- Native Web Contents – This query is used to query the Graph API directly, this will not handle pagination over 1000 objects.
- Invoked Logic App – If you implemented the logic app to query the data, this query will be used to interact with the Logic App to gather data.
- Template Graph Call – This query will use the odata query to obtain the data from the Graph API, this will handle pagination natively.
There is not a template query for the Log Analytics Workspace, however you can copy the query of the WUfB report and modify it to suit your needs.
Tips & Tricks from the Session
- Friendly Names Everywhere – Rename your columns and tables to something that makes sense enmasse, this will make it easier to build out your reports collaboratively.
- Set your Data Types – Ensure you set the data types for your columns, this will ensure that the data is displayed correctly in the report & it will also enhance the report performance.
- Only Get the data that is required – When querying the Graph API, only select the fields that you need, this will reduce the amount of data that is returned and will also improve the performance of the report.
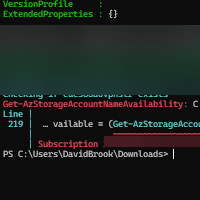


Been using this method for reporting for a while and been working really well. Last week the graph data stopped updating. DeviceIdentityAttestationDetail does not exist. Looks like Microsoft have have changed something that has broken this. Any idea how to resolve this
Hi Alex,
Yeah, Microsoft removed a complex type from that property in the metadata. It caused me quite a week last week 🤣.
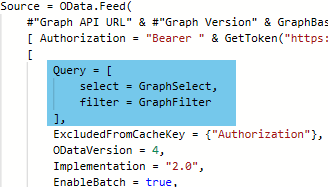
There is a way around it, and I plan on writing up a blog post on it shortly, essentially, you need to add a query section to the header and select just the properties you need.
Ultimately, this isn’t a fix just a work around, but it does highlight the importance of just selecting what we need 😊. I will keep you posted on the post 😊
Hi Alex,
I have now updated the GitHub PBIT file, I have also added a notice to the top of this post with a Link to update the Intune Common Data query to bypass the issue.
Hi David,
That’s perfect new query worked a treat.
Thanks,
Alex
Great work!
I have run through all the steps, have the App registered, read access granted including to Analytics Workspace.
Open the Powerbi file, enter all the information but – keeps telling me to enter credentials. I have gone back and checked everything.
Any suggestions?
Hey Paul,
Do you have a screenshot of the prompt you are seeing?
Hi,
In the Template Query, I get an error “Expression.Error: The name ‘GraphSelect’ wasn’t recognized. Make sure it’s spelled correctly.”
Tried searching on Google for correct syntax, but no luck, any ideas?
On all the WUfB Reports I get “Access to the resource is forbidden”. Log analytics Workspace ID is configured correctly.
Thanks
Hi Marlin,
I hope you are doing well :).
I have just followed through the blog post and was able to sucesfully get the report to load without issue.
Firstly, for the GraphSelect query, have you tried to copy this to another Query, or is it on one of the default queries?
Secondly, the WUfB Reports, Did you grant the application the data.read.all application permissison and grant it Reader rights to the LAW?